Substantial but Misunderstood Human Sexual Dimorphism Results Mainly From Sexual Selection on Males and Natural Selection on Females. William D. Lassek and Steven J. C. Gaulin. Front. Psychol., May 17 2022 | https://doi.org/10.3389/fpsyg.2022.859931
Abstract: Human sexual dimorphism has been widely misunderstood. A large literature has underestimated the effect of differences in body composition and the role of male contest competition for mates. It is often assumed that sexually dimorphic traits reflect a history of sexual selection, but natural selection frequently builds different phenotypes in males and females. The relatively small sex difference in stature (∼7%) and its decrease during human evolution have been widely presumed to indicate decreased male contest competition for mates. However, females likely increased in stature relative to males in order to successfully deliver large-brained neonates through a bipedally-adapted pelvis. Despite the relatively small differences in stature and body mass (∼16%), there are marked sex differences in body composition. Across multiple samples from groups with different nutrition, males typically have 36% more lean body mass, 65% more muscle mass, and 72% more arm muscle than women, yielding parallel sex differences in strength. These sex differences in muscle and strength are comparable to those seen in primates where sexual selection, arising from aggressive male mating competition, has produced high levels of dimorphism. Body fat percentage shows a reverse pattern, with females having ∼1.6 times more than males and depositing that fat in different body regions than males. We argue that these sex differences in adipose arise mainly from natural selection on women to accumulate neurodevelopmental resources.
Discussion
As stressed throughout, reliable sex differences are not, by themselves, evidence of sexual selection. As in some other species, natural selection may favor differences between females and males. For example, in raptorial birds the conflicting effects of larger size—increasing fecundity in the sex that lays the eggs, but compromising agility in the sex doing (more of) the hunting—has led to disruptive natural selection such that females are larger than males in many species. This females-larger pattern has evolved independently in the Accipitriformes, Falconiformes, and Strigiformes, groups now known to not be closely related (Schoenjahn et al., 2020).
There are at least two potential sources of divergent natural selection pressures on women and men that might broadly parallel this avian situation: (1) being the sex that gestates and lactates, women might experience certain survival or fertility differentials that are not relevant to men (section “Increase in Female Stature to Accommodate Larger Brained Fetuses”), and (2) a widespread and apparently ancient sexual division of labor might favor different phenotypes in the two sexes, as discussed below.
Can Natural Selection Explain Dimorphism in Stature, Mass, and Strength?
In addition to sexual selection, natural selection can also produce sex differences in body size, though it seldom favors larger males. For example, natural (i.e., fecundity) selection can favor larger female size, notably in insects and fishes (Perrone, 1978; Thornhill and Alcock, 1983; Andersson, 1994), as realized by Darwin (1871). Likewise, divergent foraging niches can also produce sexually dimorphic body size, perhaps the best examples being raptorial birds where, again, females are consistently larger than males (Newton, 1979; Andersson and Norberg, 1981; Schoenjahn et al., 2020).
A sexual division of labor, with males concentrating on hunting mobile prey and women focusing on immobile plant foods is nearly universal among human foragers (Murdock, 1937; Gurven and Hill, 2009) and possibly primitive in the chimp-human clade given that hunting, while rare, is a nearly exclusive male activity in common chimpanzees (Mitani and Watts, 2001; Mitani et al., 2002). It has been suggested that this ecological sex difference could have generated natural selection for sexual dimorphism in human body size (Kaplan et al., 2000).
Evidence from modern hunter-gatherer groups suggests that male hunting provided a major portion of calories, fat, and protein to their families (and other families of their group through meat sharing) during human evolution (Cordain et al., 2000; Gurven and Hill, 2009). Given that men’s hunting ability correlates positively with their muscle mass (Apicella, 2014) perhaps natural selection played a role in shaping both the sexual division of labor and sex differences in muscle mass.
The evidence on this issue is scant and indirect. Wolfe and Gray (1982b) conducted a cross-cultural analyses of stature dimorphism in relation to mode of subsistence. They found that, compared to hunter-gatherers, agriculturalists (whose sexual division of labor is less marked) actually exhibit more stature dimorphism and that, overall, a more equal division of labor was not associated with a reduction in stature dimorphism.
Based on a different cross-cultural sample, Holden and Mace (1999) used a sophisticated analytical strategy that controlled for both cultural and geographic relatedness among their sample populations. In their analyses, foraging populations showed the same levels of stature dimorphism as farming populations. However, dividing their cases differently, they found that cultures where women provide a higher proportion of food than men (regardless of how food is procured) showed less stature dimorphism. They suggested that this was the result of female offspring being better nourished in populations where women are the primary providers. In support of this interpretation they showed that sex biases in juvenile mortality showed a parallel pattern—juvenile males survive better where men contribute more to subsistence and juvenile females survive better when women contribute mere.
Using a genomic approach (Arner et al., 2021), examined allelic differences associated with a number of sexually dimorphic human phenotypes including height and body mass. They found no evidence of post-agriculture changes in the intensity of selection at these loci. In other words, the available evidence indicates that changes in subsistence have not had appreciable effects of human dimorphism, suggesting that human dimorphism is not primarily shaped by selection related to subsistence.
Dimorphism and Male Mating Success
Sexual selection arising out of competition for mates can cause a wide array of sex differences, but they broadly cluster into two major types: those that increase attractiveness to the opposite sex, and those that increase the ability to exclude same-sex competitors from mating (Andersson, 1994). The reasons why mating competition takes one form or the other are not fully understood (but see Gaulin and Sailer, 1984; Puts, 2010 for some suggestions), but the former is predominant in birds and the latter predominant in mammals.
How are we to assess the relationship between dimorphism and male mating success over the course of human evolution? A meta-analysis of the relationship between “status” (measured variously as physical formidability, hunting ability, material wealth, and political influence) and several male fitness components across 33 non-industrial societies found a consistent positive effect, but a weaker effect than in non-human primates (von Rueden and Jaeggi, 2016) which could be taken to indicate a weakening of male contest competition in extant humans accompanying the spread of monogamous marriage systems. A study of Y-chromosome distribution found evidence of a recent shift from polygyny to monogamy (Dupanloup et al., 2003).
However, contemporary fitness effects may not be relevant to explaining the selective forces that produced the extant pattern of human sex differences. It is a cornerstone of evolutionary explanation that current traits are the result of selection pressures that operated in ancestral populations (Tooby and Cosmides, 1990). Thus, if the present is different from the past, the fitness differentials that produced the trait may no longer obtain. Of possible relevance to reconstructing selective regimes, we can discover no law prohibiting polygamy earlier that the (British) Bigamy Act 1603.
Because we have no direct evidence of the human matting system during the period when human patterns of dimorphism were shaped, it seems reasonable to give more weight to the genetic evidence provided by the Y-chromosome. Genetic studies uniformly find much less genetic diversity in the human Y-chromosome than in human mitochondrial DNA which is passed only through females. This is consistent with a smaller effective male population size and higher variability in male than female reproductive success (Destro-Bisol et al., 2004; Wade and Shulter, 2004; Wilder et al., 2004a,b; Shriver, 2005; Hammer et al., 2008, 2010; Favre and Sornette, 2012; Heyer et al., 2012; Balaresque et al., 2015; Karmin et al., 2015; Poznik et al., 2016). This is also reflected in demographic data showing higher variance in male reproductive success across a range of tribal societies (Betzig, 2012).
Although a sexual division of labor might generate natural selection for hunting ability, there is substantial evidence that dimorphism related to hunting ability has been under sexual selection. In Hadza hunter-gatherers, upper-body strength predicts hunting success, prestige, and reproductive success (Apicella, 2014) and there are similar benefits in the Tsimane (Gurven and von Rueden, 2006) and Ache (Hawkes, 1991). Successful hunters achieve elevated reproductive success through a number of pathways (e.g., Kaplan and Hill, 1985; Smith, 2004). Hunting may provide males a costly signaling venue to display traits attractive to females (Bliege-Bird et al., 2001). In other words, sexual division of labor itself may be, at least in part, a consequence of disproportionate male mating competition. The same muscular attributes useful in hunting may also have been sexually selected by providing advantages in aggressive competition among men (or groups of men, see Zeng et al., 2018) for access to mates.
In addition to male muscularity serving a direct role in competing with other males, a number of studies have shown that it is also associated with female judgments of male attractiveness (Horvath, 1981; Dixson et al., 2003; Fan et al., 2005; Geary, 2005; Dixson and Dixson, 2007; Frederick and Haselton, 2007; Honekopp et al., 2007; Dixson et al., 2010b) and with reproductive success in China (Schooling et al., 2011), although men may overestimate how much muscle mass is optimally attractive (Lei and Perrett, 2021). These female preferences would have evolved only if there were preexisting fitness benefits to male muscularity (e.g., in contest competition for mates or in hunting).
Sex differences in body mass, muscle mass, and strength are typical outcomes of sexual selection in mammals generally and primates in particular. Their frequency in related species does not guarantee that they were caused by the same sexual-selection processes in humans. However, our confidence that they were will be increased if we see evidence that male mating competition had produced sexual dimorphism in other traits that are not obviously related to hunting.
We can begin with the observation that males are the “fast” sex (sensu Clutton-Brock and Vincent, 1991) in humans, returning to the mate pool more quickly and thus more likely to find mates scarce. Quantitative evidence indicates that more men are excluded from fatherhood than there are women excluded from motherhood, the essential consequence of differential mating competition. For example, there is higher variance in male than female reproductive success across a range of societies and that variance difference increases as populations become more sedentary (Betzig, 2012).
If men evolved to exclude competitors from mating they should have psychological traits designed for that purpose, such as increased aggression, and many kinds of data indicate that men are more physically aggressive than women (Archer, 2009). An indication of how pervasive fighting between young males is in the US can be is found in the results of biennial surveys of American high school students. From 1993 to 2019, an average of 39% of males vs. 23% of females in grades 9–12 in American schools were involved in one or more physical fights in the previous 12 months (NCES, 2021).
A number of studies have found a positive relationship between male reproductive or mating success and aggression (Sadalla et al., 1987; Chagnon, 1988; Connolly et al., 2000; Charles and Egan, 2004; Llaurens et al., 2009) and physical dominance (Puts et al., 2006; Gangestad et al., 2007; Markey and Markey, 2007; Bryan et al., 2011) supporting the idea that human male aggression is the result of sexual selection (Archer, 2009; Georgiev et al., 2013), as it in other mammals (Gómez et al., 2016). Human females are more prone to choose aggressive and combative males as mates when they feel in danger from other males (Snyder et al., 2011).
The more extreme the nature of the violence, the more extreme are the observed sex differences. Because it is less likely to be an effect of differential socialization by sex, the least contaminated assay of evolved sex differences in aggressive tendencies is same-sex homicide outside of warfare (within-society homicides), because they are nowhere condoned for either sex. Nevertheless, a very large sex difference remains. Men are much more likely to kill a man than a woman is to kill a woman; the discrepancy is large and relatively stable across time and across different modes of subsistence, with males accounting for approximately 95% of all same-sex homicides (Daly and Wilson, 1990). The most common “motive,” according to standard federal reporting criteria, is not robbery but “incident of trivial origin”—status competition that went further (perhaps) than the competitors expected (Daly and Wilson, 1988).
Homicide related to mating competition is a frequent occurrence in many hunter-gatherer societies (Kruger and Fitzgerald, 2012; Allen and Jones, 2014), including the “harmless”! Kung, in which most homicides are related to competition for women (Lee, 1993). In the Gebusi, for example, a group with a very high homicide rate of 7 per 1,000, the professed cause was to punish sorcery but the actual cause was to increase male control of marriageable women (Knauft, 1987). Across cultures, time, and species, lethal male-male aggression is strongly related to mating competition (Kruger and Fitzgerald, 2012).
In that context it is relevant that men’s (but not women’s) proneness to anger and history of physical aggression are both correlated with their own physical strength, suggesting psychological mechanisms for the strategic deployment of aggression against conspecifics (Sell et al., 2009); “don’t start it unless you can win it.”
Of course, in addition to competition between individual men within groups, there is also substantial evidence for persistent violent competition between groups in the form of warfare or raiding, which is the most common form of killing seen in chimpanzees (Bowles, 2009; Puts, 2010; Allen and Jones, 2014; Puts et al., 2015; Puts, 2016; Hill et al., 2017; Mann, 2018). Competition between patrilineal groups has been suggested as the cause of a post-Neolithic Y-chromosome bottleneck (Zeng et al., 2018).
When men attack each other (in the absence of weapons) fists slamming into faces is a common pattern. Sexual selection may have been at work in this domain as well. The particular facial bones most frequently fractured in such altercations evolved greater robusticity such that they have been for several million years, and continue to be, the most sexually dimorphic elements of the human skull (Carrier and Morgan, 2015), suggesting that such conflict was predominantly a male-male affair.
If faces are targets of attack in male contest competition, selection may have produced beards as adaptive protection. Beards are a notably derived (e.g., compared to chimpanzees, where the area around the mouth is one of the least hairy regions), and highly dimorphic feature of human anatomy (Darwin, 1871). Facial hair is morphologically distinct from scalp hair in ways that may allow it to deflect and/or absorb blows to the face (Beseris et al., 2020). Men perceive potential competitors with full beards as more dominant (Puts, 2010; Dixson and Vasey, 2012; Dixson et al., 2017a). As we would expect if it plays a role in male contest competition, beardedness is more prevalent in countries with male-biased sex ratios (Dixson et al., 2019), under crowded conditions (Dixson et al., 2017b), and where economic inequality is high (Dixson and Lee, 2020; Pazhoohi and Kingstone, 2020). Compared to clean-shaven faces, beards enhance judgments of male facial masculinity, dominance, and aggressiveness, irrespective of underlying facial structure (Sherlock et al., 2017; Mefodeva et al., 2020). Likewise, beards enhance the speed and accuracy of detecting an angry facial expression (Craig et al., 2019; Dixson et al., 2021).
If beards are a sexual display, which sex are they displaying to? Several studies that compared the effects of beards on dominance or aggressiveness judgments by men with their effects on attractiveness judgments by women found the male-male effects significantly stronger (Puts, 2010; Dixson and Vasey, 2012; Dixson et al., 2017a). Still, there is some evidence for female preferences, notably that beardedness is more common where pathogen stress is high (Dixson and Lee, 2020; Pazhoohi and Kingstone, 2020), suggesting female choice for good-genes benefits.
Other sexually dimorphic features are even less plausibly related to an adaptive specialization for hunting but apparently related to aggressive male-male interactions. The one-octave sex difference in habitual voice pitch is an example (Puts et al., 2006). Lower voice pitch is much more strongly related to male dominance perceptions than to female attractiveness perceptions (Puts et al., 2007; Hodges-Simeon et al., 2010; Rosenfield et al., 2020), and situational lowering of male voice pitch elevates listeners’ perceptions of the speaker’s aggressive intent (Zhang et al., 2021).
The strong sexual dimorphism in both voice pitch and facial hair results in what animal behaviorists would call male sexual ornaments. Comparative research suggests that men are roughly as ornamented as males in polygynous primate species with large, fluid social groups (Dixson et al., 2005; Grueter et al., 2015). Beards and low-pitched voices are especially relevant to our analysis because an array of experimental studies links them to aggressive male-male competition in a way that they cannot be plausibly linked to the alternative hypothesis of selection for hunting abilities.
Lastly, ontogeny also provides relevant evidence about the evolution of human sexual dimorphism. The sex differences that are the focus of our article—stature, body mass, body fat and lean mass, fat distribution, muscularity and strength—all emerge or are significantly amplified around sexual maturity. This timing suggests they are related to reproduction rather than to sex-specific ecological adaptations.
Increase in Female Stature to Accommodate Larger Brained Fetuses
Gestation and lactation are demanding mechanically, energetically, and in terms of supplying particular nutrients to the fetus (e.g., calcium for the skeleton, fat for the brain). Because males do not face these demands it would be surprising if disruptive natural selection had not caused female and male phenotypes to diverge with respect to these demands. We have suggested two such adaptations.
One is the increase in female stature relative to males. With the transition to larger-brained Homo from earlier Australopithecus, sexual dimorphism in stature decreased. This decrease is widely regarded as indicating a shift to a more monogamous mating system with a concomitant decrease in male mating competition (a sexual-selection explanation). But this explanation ignores potentially relevant facts: The decrease in stature dimorphism was accomplished via size increases in both sexes, with the female size increase being relatively greater than the male.
We interpret these facts as indicating some novel selection pressure on females, and specifically highlight the difficulty of delivering a large-brained infant.
Our analyses of contemporary data show that taller women, and women closer in stature to their mates, are less likely to experience an emergency Caesarian section (a proxy for the kinds of birthing difficulties that would have reduced female fitness during hominin evolution). To the extent that our data are relevant, the current level of human stature dimorphism seems: (1) to have been significantly shaped by viability and fecundity selection on women and, (2) consequently, underestimates the intensity of sexual selection on males.
Why Do Women Have so Much Fat?
The second adaptation in human females likely brought about by natural selection is the increase in the percentage of body fat. Currently, there is no scientific consensus about why women (and to a lesser extent men) have such high levels of body fat. Fat is heavy and, unlike muscle, does not contribute to its transport costs. For this reason, no animal should store more fat than it needs.
One suggestion is that hairlessness increased our need for insulation against hypothermia (Kushlan, 1980) although, even if correct, this idea would not explain the sex difference. Pond (1992) has presented comparative mammalian evidence from the Carnivora, an order with species in a wide array of habitats from tropical to polar, and found no support for the idea that fat deposits evolved primarily for insulation. Moreover, hominins were a tropical lineage throughout most of their history with relatively little need for insulation. If insulation were the main purpose of human fat we should have very little, or there should be large population differences in body fat—correlated with latitude—that evolved as our ancestors began moving out of Africa.
Wells (2012a) shows a very weak positive correlation between peripheral body fat (as assayed by triceps skinfold) and latitude, but only when he omits the Polynesian populations from his sample. Regardless, tropical African hunter-gatherers such as the Hadza at 10.6–13.5% body fat for men and 19.0–20.9% body fat for women (Sherry and Marlowe, 2007; Pontzer et al., 2012) have far too much adipose to support the insulation hypothesis for high levels of human fat deposition.
The obesity epidemic, while real, is also not the explanation, because Wells’s (2012a) sample of non-industrial populations (Table 1) and our sample of foragers and horticulturalists (Table 1 and Supplementary Table 1) show that high levels of body fat are human universals.
Because only women gestate and lactate, this sex difference is widely assumed to have favored their disproportionate fat deposits (e.g., Frisch, 1984; Power and Schulkin, 2008; Kirchengast, 2010). But if this were the correct explanation, all mammals should exhibit similar sex differences in body fat. In contradiction to this expectation, significant sex differences in total fat deposition are not the norm in mammals (Pond, 1978; Pond and Mattacks, 1985) nor in primates, and sometimes are skewed in the opposite direction with males being fatter (Macaca fasicularis: Pond and Mattacks, 1987; Papio anubis: Eley et al., 1989; Papio cynocephalus: Altmann et al., 1993; Macaca mulata: Colman et al., 1998; Callithrix jacchus: Power et al., 2001; Macaca fuscata: Hamada et al., 2003; Propithecus verreauxi: Lewis and Kappeler, 2005; Raman et al., 2005).
Could the higher fat levels in human females be due to their needing more energy during pregnancy and lactation than other primates? This seems unlikely. Studies show that the energy costs of pregnancy and lactation in relation to maternal weight in humans are similar to other primates and apes, and primate females typically deal with the energy costs of pregnancy and lactation by increasing food intake (Dufour and Slather, 2002).
Although primates generally have longer gestations than other mammals, thus decreasing their daily energy requirement, the length of gestation in humans in relation to the mother’s weight is close the primate regression line (Dufour and Slather, 2002) and daily maternal energy investment is also on the regression line for other apes (Ulijaszek, 2002). Human lactation costs are also similar to other primates. The lactation period for human females (based on the !Kung) is below the regression line for primates and apes (Dufour and Slather, 2002). The relatively dilute concentration of nutrients in human milk is similar to other primates (Dufour and Slather, 2002) and the calories per gram are lower than in baboons and other monkeys (Oftedal, 1984). Women’s cost of lactation in relation to weight is much lower than in many other mammals and similar to baboons (Prentice, 1988). In other words, species differences in the energetic costs of reproduction would not seem to demand greater stored resources in women than in our primate relatives.
In species with well-defined breeding periods, males may seasonally accumulate additional fat to facilitate aggressive competition for mates (Boinski, 1987; Bercovitch, 1992) or females may do so to support their maternal investment (Hamada et al., 2003). But in her comprehensive review of fatty tissues in wild vertebrates, Pond (1978) remarked that the perpetually large fat deposits in human females are very unusual.
The exceptional nature of women’s high fat storage is further underscored by a comparative analysis across 87 mammal taxa which showed that, in species with alloparental care—whether by the father or others—females store less fat (Heldstab et al., 2017) presumably because, by providing some resources, fathers and allomothers reduce the demands on mothers. It has been estimated that alloparenting decreases the lifetime reproductive effort of human females by 14–29% compared with other mammals (Bogin et al., 2014). Thus, to be as large they are, to manifest relatively early in development, and to be so permanent in a species with significant alloparental care, women’s fat deposits must have been shaped by both strong and relatively unique selection pressures.
Perhaps women’s higher percentage of fat is explained by another unique human trait: our large brains. All female mammals must provision the development of their fetus and infant, but none must build as large a brain in proportion to their own body size. Brains not only consume large amounts of energy from glucose, but they require significant amounts of quite specific fats—notably, long-chain omega-6 and omega-3 polyunsaturated fatty acids—as major building blocks.
On a dry-weight basis, the human brain is about 60% fat (Bradbury, 2011), and two rare long-chain fatty acids, the omega-3 docosahexaenoic acid (DHA) and omega-6 arachidonic acid, each constitute about 10% of brain fatty acids (Makrides et al., 1994), with DHA playing the most critical role in brain development and function (Lauritzen et al., 2016). These essential fatty acids cannot be synthesized by humans and thus must come from the diet and be stored until needed.
The percentage of DHA in stored fatty acids reflects the percentage in the long-term diet and is seldom more than 0.4% of total adipose (Knutsen et al., 2003; Luxwolda et al., 2014). However, when there is less DHA in the diet, the concentration of DHA in stored adipose is consequently lower, and the only way to store more DHA is to increase the total amount of adipose (and hence BMI). Women with less DHA in the diet thus tend to have more fat: Female BMI is inversely related to the amount of DHA in the blood (Sands et al., 2005). Contemporary studies indicate that DHA is preferentially stored in gluteofemoral fat and then mobilized during pregnancy and lactation (see “Possible Reasons for Sex Differences in Regional Fat Distribution” below).
This neuro-developmental perspective potentially explains why human mothers need more fat than mothers of other mammalian species (Cunnane and Crawford, 2003; Lassek and Gaulin, 2006, 2007, 2008; Wells, 2006) and also explains why human neonates have so much body fat (Cunnane and Crawford, 2003; Correia et al., 2004). Because the amount of various fatty acids that can be stored is proportionate to their occurrence in the diet, and because critical omega-3 fatty acids are dietarily scarce, fat stores must be large to contain significant amounts of this critical brain-building fat (Lassek and Gaulin, 2006).
This perspective, if correct, has the advantage of uniting under one explanatory umbrella three highly derived human states: exceptionally large brains, higher levels of body fat than any non-hibernating, non-migrating mammal, and greater sexual dimorphism in body fat than any other mammal. Other hypotheses, such a need for protection against hypothermia, do not fit the comparative data and do not explain the large sex difference. From our perspective, sex differences in the percentage of body fat would be explained by disruptive natural selection favoring larger fat stores in women.
This view contrasts to some degree with the prevailing literature, where women’s fat stores are often viewed as the outcome of sexual selection acting via male choice. Given the extensive evidence concerning male mating preferences for female body shape, there is no doubt that such selection has occurred, but two issues require attention. First, the male preference should not have evolved unless it was targeting existing viability or fecundity differences among females (in other words, such preferences evolved to track what natural selection on females was already favoring). Second, as many studies make clear, the relevant target of male choice is female body-fat distribution, as discussed below.
Possible Reasons for Sex Differences in Regional Fat Distribution
The evolutionary reasons for the sex difference in adipose storage are not fully understood. Mechanically, adding weight in the form of body fat to a limb increases the force required to move it, without increasing strength, so peripheral fat must compromise the agility and power of the arms and legs. That mechanical effect could disfavor peripheral fat deposits in the sex competing more intensely for mates—males, as we have argued in the human case. But why would peripheral fat be favored in women? And why should it be localized to a few depots, rather than deposited as a smooth sheath beneath the skin of the whole body?
Various answers have been offered to one or both questions. Positioned near the center of mass of the body, the gluteofemoral depot may stabilize locomotion and provide a counter-balance to the frontal mass of a developing fetus (Pawlowski, 2001; Pawlowski and Grabarczyk, 2003). Another suggestion is that women may shunt fat from visceral to subcutaneous depots to increase the available space for gestation and to reduce intra-abdominal pressure on the fetus (Abrahim, 2021).
Another line of thinking connects to the neurodevelopmental explanation for women’s high levels of body fat (section “Why do Women Have so Much Fat?” above). Relative to other depots, the gluteofemoral depot is protected against use for ordinary energy needs but is then systematically drawn down during late pregnancy and lactation (Rebuffe-Scrive et al., 1985; Rebuffe-Scrive, 1987; Lassek and Gaulin, 2006)—the key period of fetal and infant brain growth.
During lactation most of the long-chain fatty acids in maternal milk come from stored fat rather than from the mother’s current diet (Lassek and Gaulin, 2006), and the gluteofemoral depot seems to be the primary source of the omega-3 and omega-6 fats that are essential for fetal and infant brain development (Lassek and Gaulin, 2007). Women who have adequate food supplies eat substantially less than they need to calorically support lactation and instead mobilize stored fat. Is that to provide critical materials stored in that fat?
During the female reproductive lifespan, there is a decrease in the relative amount of gluteofemoral fat with parity (Lassek and Gaulin, 2006). Based on data from NHANES 1999 to 2006, the ratio of leg fat to trunk fat (which is highly correlated with the waist-hip ratio, but measures actual fat) drops with each successive birth (Figure 2), suggesting that gluteofemoral resources are differentially consumed in reproduction. Women with a higher thigh/waist ratio have higher levels of DHA, the omega-3 fat found at high levels in the brain (Lassek and Gaulin, 2019). These polyunsaturated fats—especially the omega-3s—are relatively unstable and possibly best stored in cooler subcutaneous rather than warmer visceral locations.
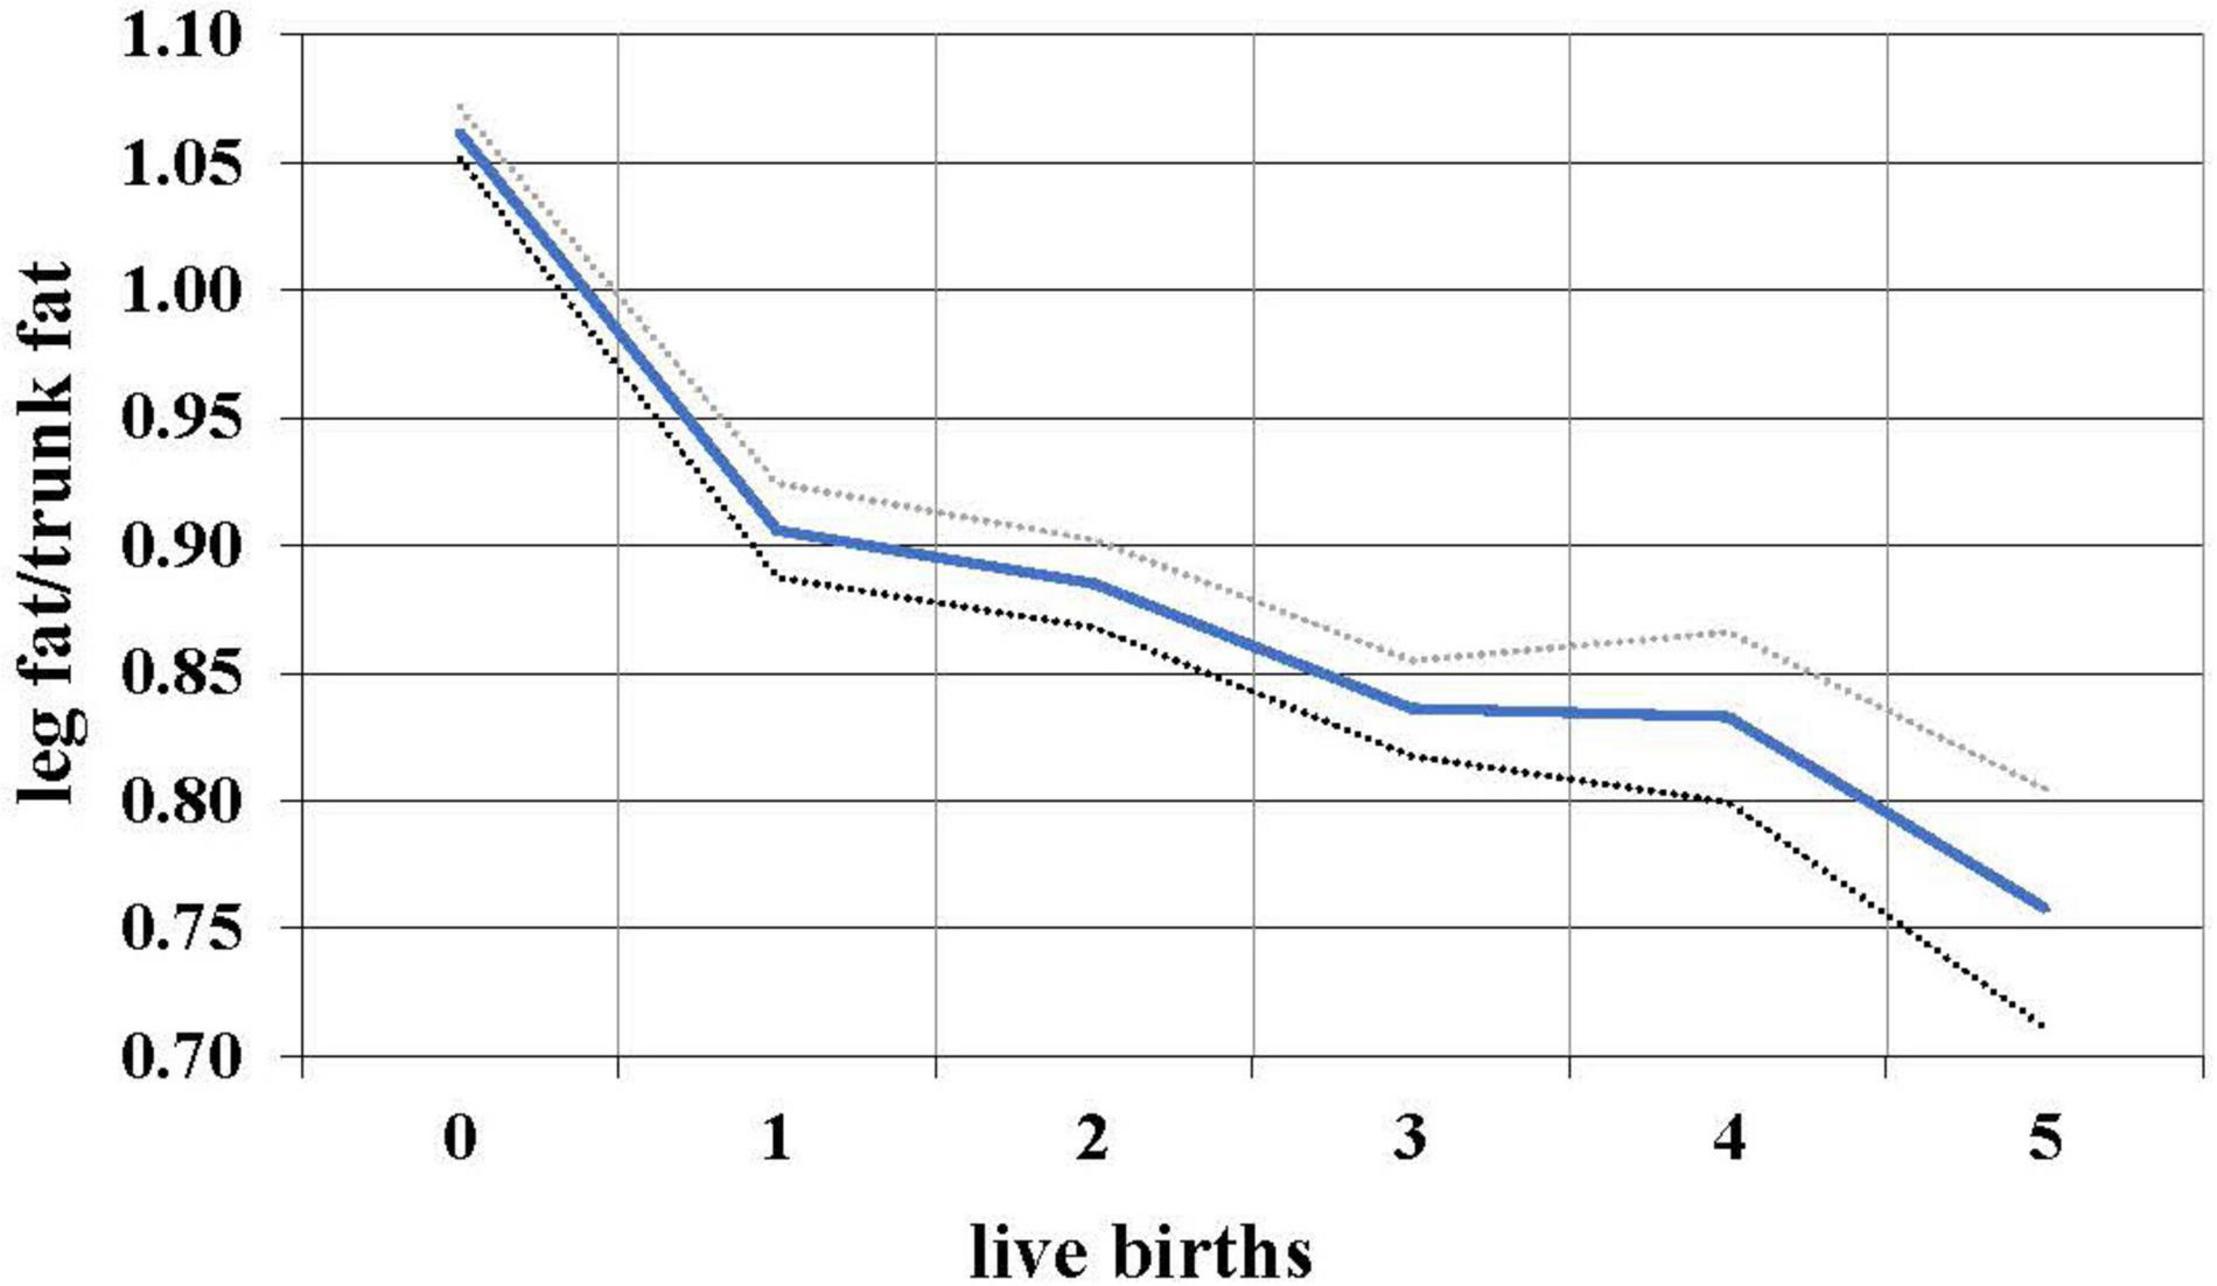
Figure 2. Relationship between live births and leg/trunk fat ratio in 7,753 women 12–49, with 95% confidence intervals, NHANES 1999–2006.
All of the effects on body fat mentioned thus far would result from natural selection, through the more efficient locomotion of the woman or through the production of infants with better-provisioned brains. However, once such selective differentials existed, sexual selection might begin to operate via evolved male preferences for women whose subcutaneous fat deposits indicated superior brain-building potential (Lassek and Gaulin, 2008). A similar argument was advanced by Cant (1981), noting that concentrated fat depots (e.g., buttocks and breasts) more effectively advertised a woman’s stored maternal resources, but did not explicitly identify neurodevelopmental resources as limiting. One study (Szalay and Costello, 1991) attributes all sexually dimorphic fat to sexual selection, but that explanation is incomplete; some pre-existing adipose-related fitness gradient in women is a precondition for the evolution of male preferences that track the gradient.
This logical requirement suggests there was prior natural selection on females for discrete fat depots, perhaps sorted by type of fatty acid and/or intended usage—with male preferences simply evolving to differentially attend to the depots most relevant to female mate quality. Currently, the gluteofemoral depot is the primary source of brain-building fats (above). That fact is consonant with the extensive psychological literature showing that men selectively attend to women’s waist/hip ratios in evaluating female attractiveness (e.g., Singh, 1993; Sugiyama, 2005; Singh and Randall, 2007; Dixson et al., 2010a,b, c, 2011; Brooks et al., 2015), with some researchers arguing that preference data suggest the waist/hip ratio is a supernormal stimulus (Marković, 2017). Several reviews have evaluated and rejected the idea that waist/hip ratios broadly track health and fertility (Lassek and Gaulin, 2018a,b; Bovet, 2019), thus suggesting it provides more specific information content.

